
Updated: October 2026
Analysis of Refinery gas starts with the decision to identify stream composition, monitor a process component, or detect an ambient hazard. Match the measured quantity and sampling system to that duty and then compare instruments.
Analysis of refinery gas supports multiple decisions in refinery operations. A fuel header can supply several heaters while receiving gas from changing process units. The laboratory requires composition, operations requires timely control information, and the safety team requires appropriate hazard detection. Buying one instrument against all three requests can leave a measurement missing. A list of decisions and the quantities required by each is a good starting point.
Refinery gas composition: define the measured stream
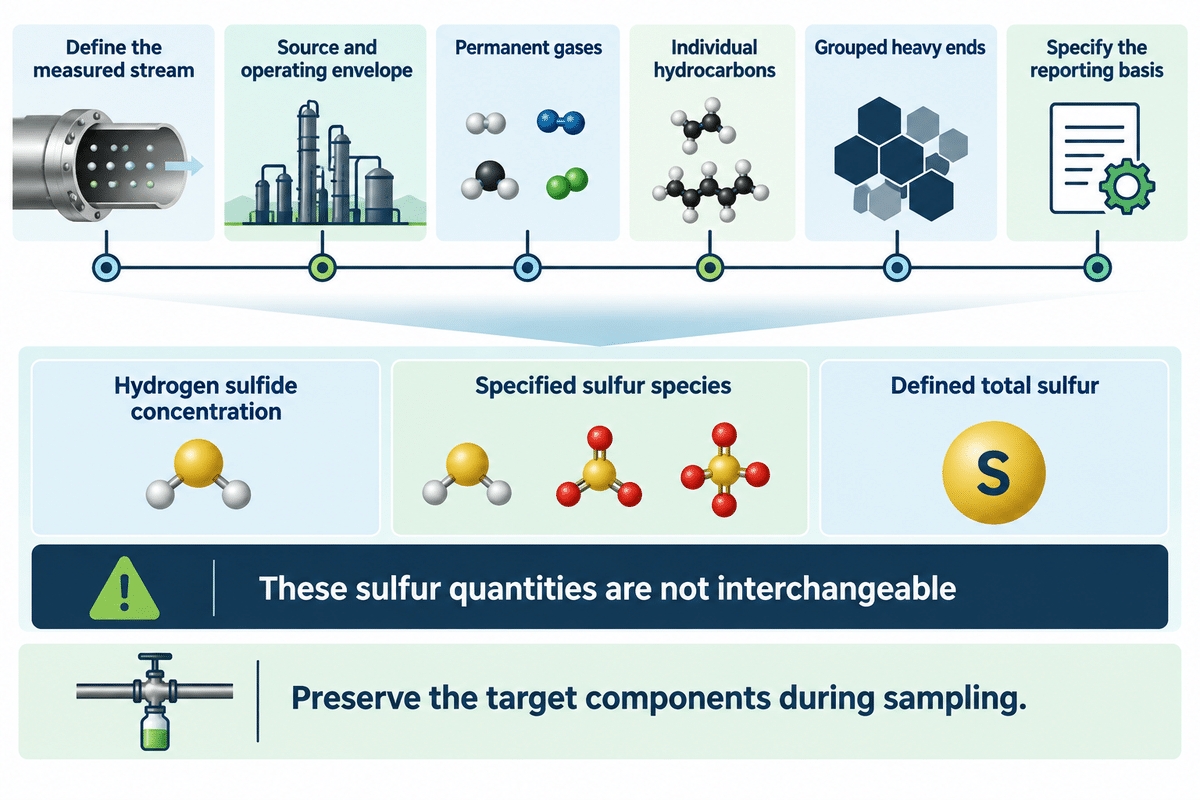
Define a refinery stream by its source, anticipated components, and operating range. Refinery gas is not a fixed blend. A request for composition should identify the permanent gases, individual hydrocarbons, grouped heavy ends and sulfur measurement requirements, and the basis for reporting needed for a given duty.
Typical sources include fuel headers, recycle systems, gas from desulfurization and process off-gas associated with crude oil conversion. Hydrogen, methane, ethane, ethylene, propane and propylene can be relevant to different analyses. Nitrogen, carbon dioxide and carbon monoxide should be on the list if the process question so requires. A pipeline natural gas specification shouldn’t automatically be the specification for every petroleum gas stream.
ASTM D7833-20 covers the chromatographic analysis of noncondensed gases and light hydrocarbons. It assigns heavier-than-benzene hydrocarbons to a C7+ group and identifies proper vaporization as a requirement for correct analysis of heavier components. Grouped and individual molecular species results answer different questions.
Of the listed characteristics of specification, one line is devoted to the specification of sulfur. Measurement of hydrogen sulfide is different from speciation of sulfur or total sulfur. ASTM D5504-20 discusses volatile species of sulfur, including applications to refinery fuel gas, using gas chromatography and chemiluminescence. The measured species are those that elute under the chosen chromatographic conditions. This distinction matters when protecting a catalyst from a specific contaminant.
Map refinery gas measurements to process duties
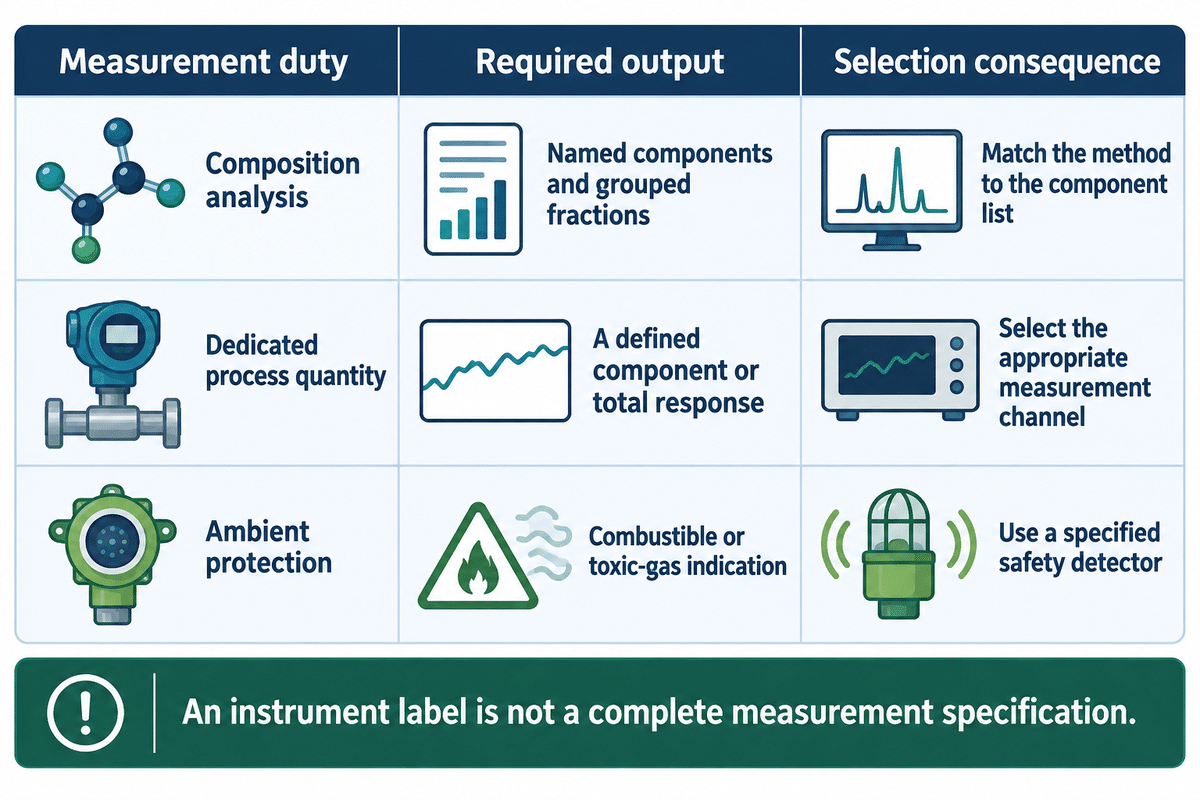
Three measurement duties are used to organize the project: composition, a dedicated process or emission quantity, and ambient protection. The 3-Duty Refinery Measurement Map below relates each duty to a usable outcome. The name of the refinery unit, in and of itself, isn’t sufficient to determine the appropriate detector for analysis and define the full analytical scope of the project.
| Measurement category and location | Measurement deliverable | Selection consequence |
|---|---|---|
| Composition: fuel header | Named fuel components and explicitly grouped fractions | Match chromatographic channels or another suitable analytical method to the fuel-quality calculation. |
| Composition: recycle stream | Required species within the recycle matrix | Set the component list for the recycle decision rather than copying the fuel-header specification. |
| Dedicated process quantity: hydrogen | Hydrogen concentration in the process matrix | Use an appropriate hydrogen measurement; an aggregate hydrocarbon channel answers a different question. |
| Dedicated process quantity: oxygen | Oxygen concentration at the selected process point | A suitable component analyzer can serve this narrow task without a complete composition package. |
| Dedicated process quantity: H2S | Hydrogen sulfide concentration | Preserve the target constituent through sampling and distinguish H2S from other sulfur quantities. |
| Dedicated process quantity: sulfur speciation or total sulfur | Specified sulfur species or a defined total | Select and validate the required analytical coverage rather than substituting an H2S-only result. |
| Emission measurement: stack | The pollutant quantity required by the applicable emission method | Include the method’s sampling, calibration and reporting basis. |
| Flare measurement under an applicable monitoring rule | Required composition, heating value and valid monitoring data | Match the selected route to its calibration and data-handling provisions. |
| Ambient protection near equipment | Appropriate combustible or toxic-gas indication | Use the specified safety detector and installation design rather than treating a process composition result as an ambient alarm. |
The map supports refinery gas analysis applications without transforming every duty into a chromatography project. The operating objective might be to optimize a fuel blend, track a component after treatment, or identify an unwanted atmospheric release. Those objectives require different measurement locations and response definitions.
Stack gas and off gas also need distinct measurement scopes: a stack-emission requirement is not automatically a process-composition requirement. For a project associated with propylene production, the useful specification defines the measured stream and the required output, as opposed to relying on the production unit name.
These rules define heating-value measurement routes and related requirements for flares covered by 40 CFR 63.670. Its continuous composition route measures components at least once every 15 minutes. A total hydrocarbon reading taken alone doesn’t satisfy the requirement. Applicable monitoring also includes calibration and data-validity requirements under section 63.671.
Not all composition routes addressed by these rules are given by Gas chromatography. Requirements on continuous processes of mass spectrometry without chromatography are set by Section 63.671(f). The method selection must retain the applicable calibration, component-response and data-quality provisions.
Gas chromatography vs total hydrocarbons vs gas detection
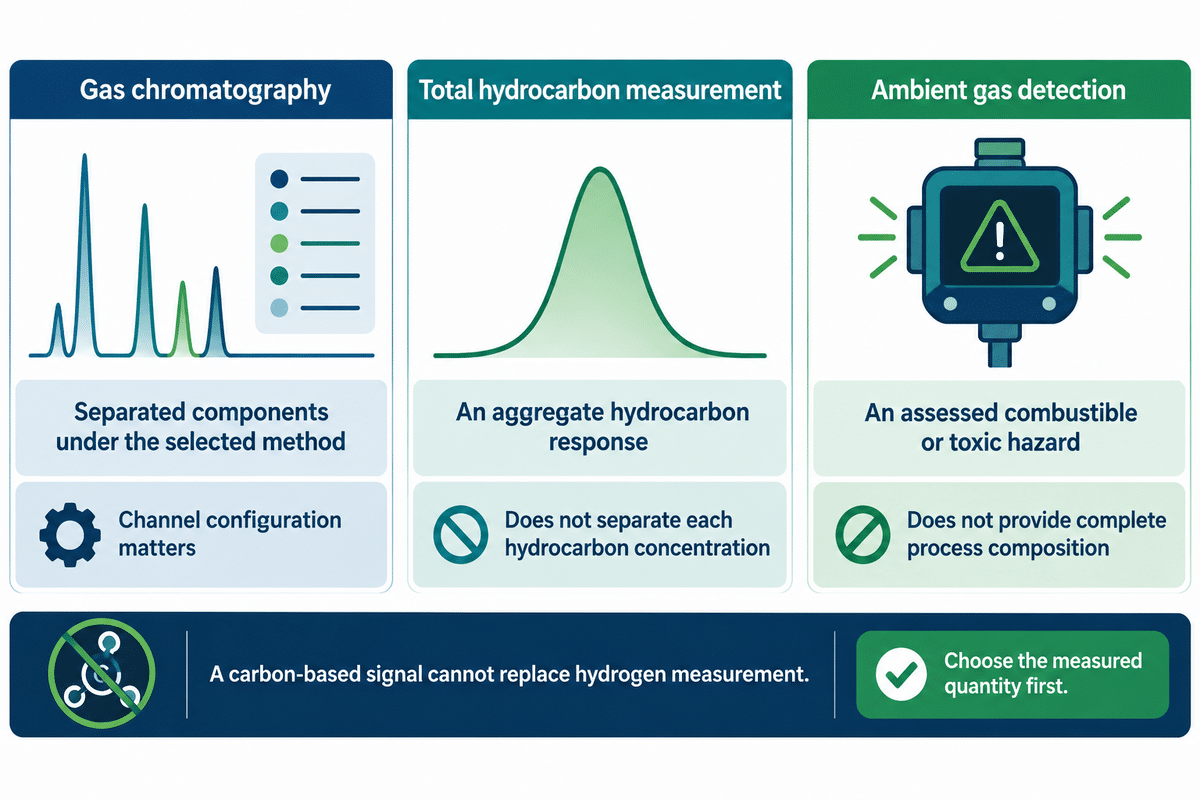
Use gas chromatography when the decision requires separated components by the method used. Use a total hydrocarbon measurement when a total hydrocarbon quantity responds to the question. Choose ambient gas detection for its assessed hazard. Each approach measures a different quantity; a common gas name doesn’t indicate their outputs are the same.
How is refinery gas analysis performed?
Refinery gas analyses are performed by collecting or continuously extracting a representative sample and applying a method suited to the required components. A gas chromatograph separates compounds. Dedicated analyzers measure required components, while others report an aggregated response.
Configuration of the detectors matters. A TCD and a FID work differently. Hydrogen and other permanent-gases questions require appropriate paths or special instruments; a carbon-based signal can’t take their place. More complex analysis is useful only if the additional outputs help to take a defined decision.
ASTM D7833 includes a wide range in its method scope as 0.03-100 mole % non-hydrocarbon gases by thermal conductivity detection and 0.005-100 mole % C1-C6 hydrocarbons by flame ionization detection. These method limits need to be correlated to the instrument’s component-specific limitations. A range label alone does not settle resolution, interference or sample recovery.
Total hydrocarbon monitoring is able to measure a total response. It does not separate methane, ethane and propane into individual concentrations without additional analytical arrangements. A low aggregate value also says little about a constituent outside that measurement’s response.
Combustible gas detection has a distinct safety function. OSHA’s Technical Manual discusses calibration-gas effects, sensor limitations (e.g. oxygen dependence) for catalytic combustible gas sensors, and a percentage of the lower explosive limit isn’t a toxic exposure concentration or complete process composition.
Example: (hypothetical) A customer requests “hydrocarbon monitoring” but in actuality needs to understand changes in hydrogen contribution. Procurement receives an attractive quotation for an aggregate hydrocarbon channel. That channel answers a different question. The engineer modifies the scope to clarify identification of hydrogen and other constituents required for the selected fuel-quality calculation, while retaining aggregate monitoring only if it serves a separate function. Then, finance can evaluate packages that yield the same information. The decision is driven by the missing quantity, not by a presumption that the most complex instrument is always better.
Specify refinery gas sampling and response time
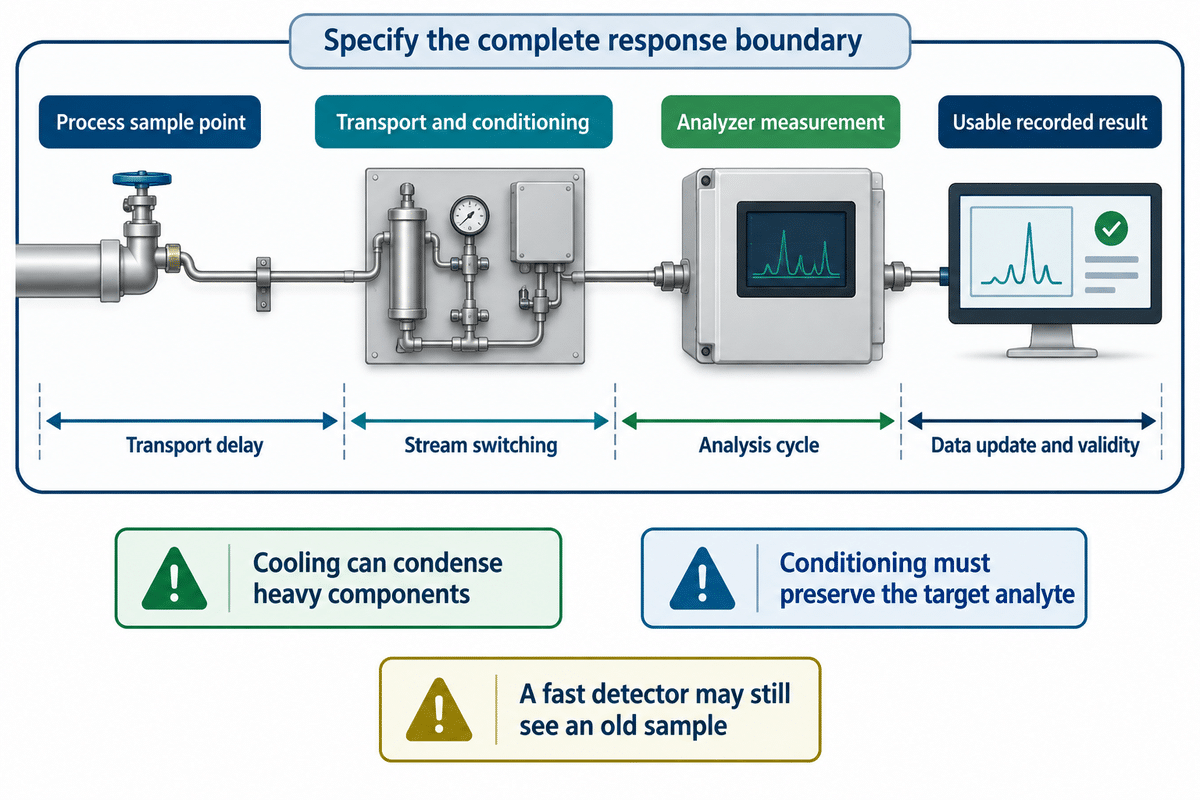
Transport, conditioning, stream selection, measurement and data update affect the usefulness of a recorded result. Specify response from the process sample point to the usable recorded result. A quick detector may still see an old or altered sample. Sample-system design must preserve the required constituents throughout the expected pressure, temperature and phase envelope.
Changes in condition and pressure of a gas can impact sample analysis. Cooling can cause heavy components to liquefy. The conditioning review should also check whether filtering or drying removes a component the analysis is meant to measure. ASTM D7833 states that some hydrogen sulfide can be lost during sampling. The sample conditioning systems used must be based on the analyte of interest. A sample, to be useful, must represent the process being measured.
Ian Verhappen’s sample-system engineering article treats dead spaces, lag and pressure drop as separate design checks. Flow is quoted in standard liters per minute, and before comparing it with the volume occupied in a line, its reference conditions must be determined.
Where should the gas analyzer be installed?
Locate the analyzer where the engineered system achieves sample integrity, response, environmental, and maintenance requirements. A process-near location can reduce transport distance, while a shelter can provide controlled conditions and access. The location decision must also accommodate the site’s hazardous-area design and safe sample disposal or return arrangements.
A poor tap location can’t be corrected by locating a cabinet close to the process. Conversely, a sheltered instrument can work with a properly designed transport system. The location review should cover the path from upstream to downstream, including stagnant branches, stream switching and the point at which the control system receives a valid new result.
| Boundary | Record or measurement | Responsible role | Hidden bottleneck |
|---|---|---|---|
| Process tap and probe | Stream identity, analytes, phase and operating envelope | Process engineer | Unrepresentative location or reactive-component loss |
| Transport and conditioning | Line volume, actual flow, pressure, temperature and elapsed transport | Sampling-system supplier | Deadlegs, condensation, adsorption or cross-contamination |
| Analyzer inlet to result | Method, component range, analysis cycle or defined response | Instrument supplier | Wrong configuration or a cycle time mistaken for complete response |
| Result to control system | Tag, units, timestamp, validity flag and update interval | Control integrator | Stale value presented as a fresh valid measurement |
| Complete agreed test boundary | Test materials, reference method, conditions and acceptance criteria | Owner’s quality and operations team | Acceptance test covers less of the system than the purchase requirement |
The completed boundary for a fuel-header example is “Fuel-header tap to the control system composition tag.” The deliverable is a time-aligned record of sample conditions and the result and its validity. Operations specifies the response requirement. Suppliers determine the test boundary. A detector-only response test can’t close this field.
Read gas concentration and hydrocarbon reporting bases
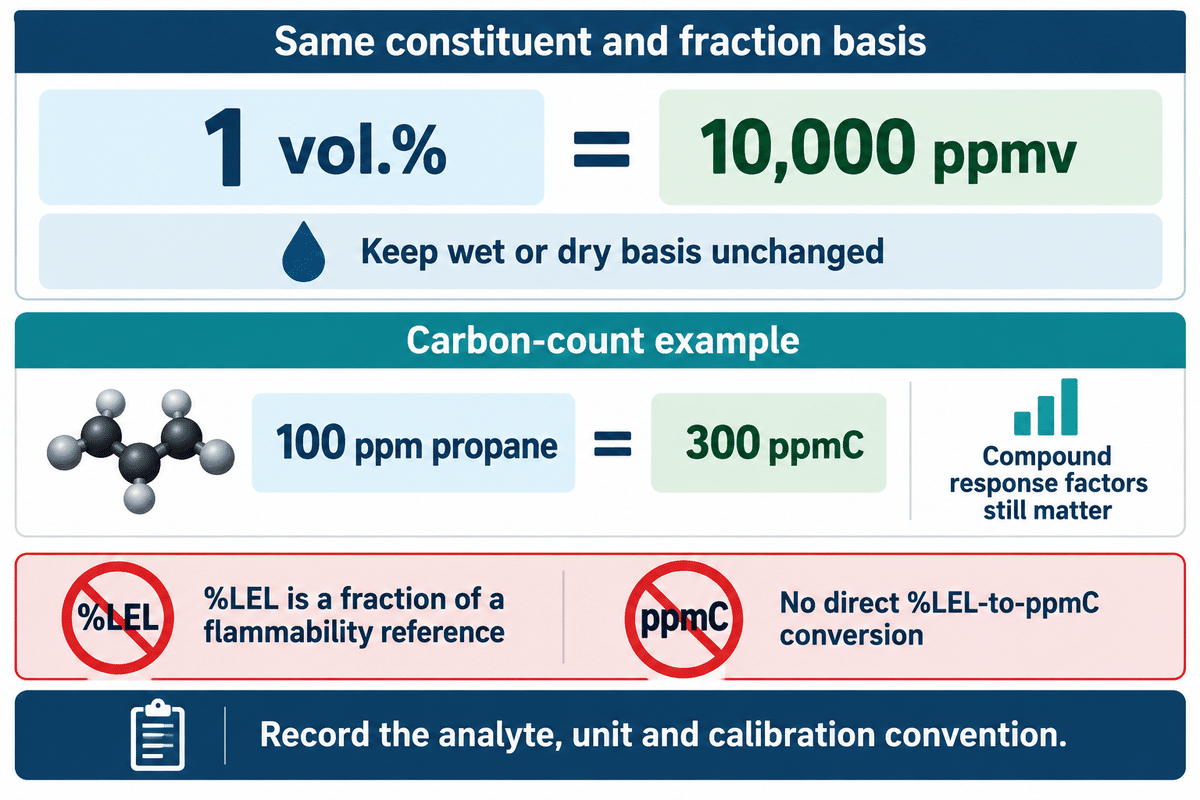
Compare concentrations only after matching the quantity and reporting basis. Volume fraction, mole fraction, mass concentration, carbon-equivalent response and percentage of the lower explosive limit describe different things. Wet or dry basis, and calibration species, should be included with the numeric value, not in an omitted footnote.
For the same volume-fraction basis, 1% equals 10,000 ppmv. Carbon reporting adds another distinction: HORIBA’s FID principle explanation uses 100 ppm propane to illustrate 300 ppmC because propane contains three carbon atoms. That carbon count isn’t permission to ignore compound response factors in a quantitative measurement.
| Given value | Equivalent or interpretation | Condition retained |
|---|---|---|
| 1 vol.% | 10,000 ppmv | Same constituent and wet/dry basis |
| 0.1 vol.% | 1,000 ppmv | Same fraction basis; arithmetic conversion |
| 0.01 vol.% | 100 ppmv | Same fraction basis; arithmetic conversion |
| 100 ppm propane | 300 ppmC by carbon count | Carbon reporting, with analytical response addressed separately |
| A value in %LEL | Fraction of a flammability reference | Gas and calibration response must be specified; not a direct ppmC conversion |
The analyte name, unit, wet/dry basis, calibration convention, and grouping rule should appear in the report header. In the specified method, a C1 result is methane and a C6+ fraction is a grouped analytical result. A number labeled only “gas concentration” leaves the comparison unfinished.
Validate the complete refinery gas analyzer system
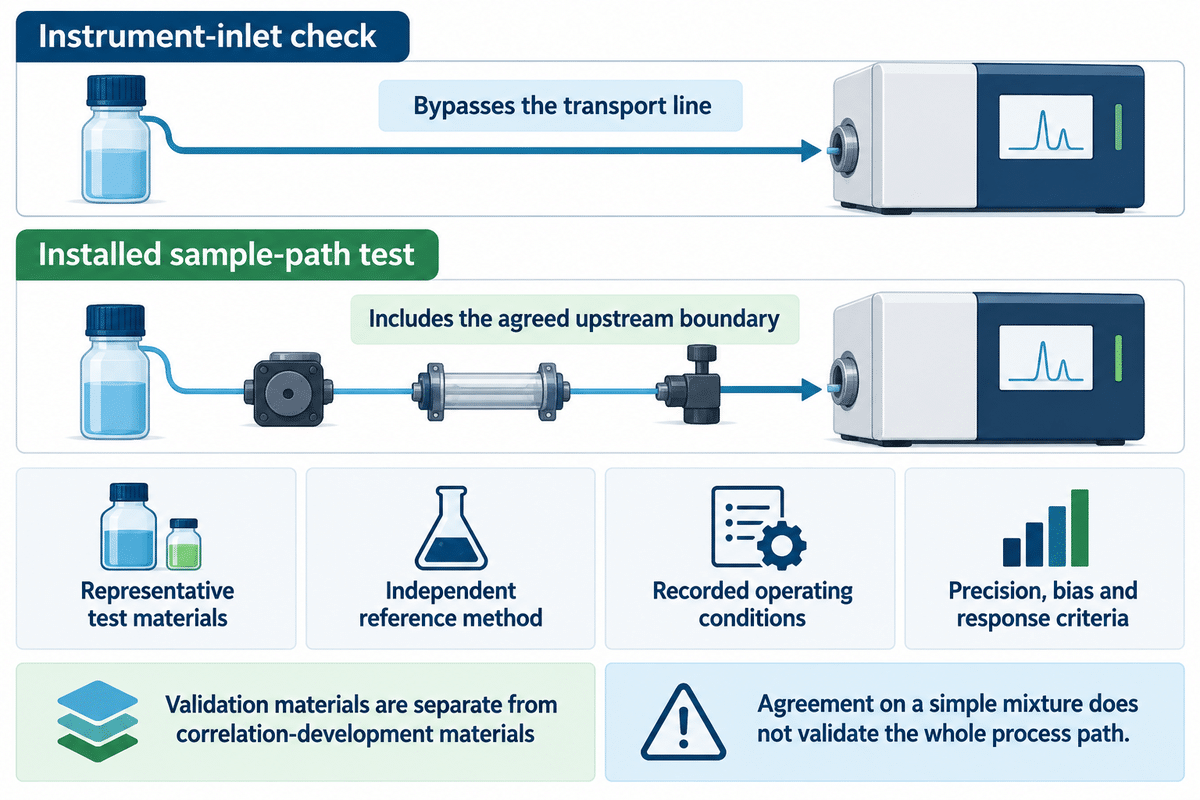
Evaluate the system with regard to the required property, representative materials and an agreed upon physical boundary. Distinguish an instrument-inlet check from a test of the installed sample path. Establish and retain the conditions under which the test was performed. Establish precision, bias and response criteria prior to the test.
ASTM D3764-23 describes process-stream analyzer performance validation. It provides a frame of reference for distinguishing validation materials from those used earlier to develop a correlation between the two measurement systems. It also limits validation to the system downstream of the specified injection or extraction point and to the tested material type and property range. A simple mixture can behave differently from a process matrix.
Calibration can’t correct for imprecision, writes Sampling specialist Tony Waters. His Swagelok calibration explanation defines checking as verifying the result against a standard and adjusting as correcting. A problem of repeatability calls for investigation of the instrument or sample conditions. Repeated adjustment can mask the underlying problem.
Example: (hypothetical) A new installation produces a stable cylinder check at the instrument inlet, but process readings don’t agree with the laboratory. The project team determines what each test covers. It’s found that the inlet check bypasses the transport line, and the laboratory sample represents a different collection time. The quality lead aligns the comparison material and timing, and a sampling supplier reviews the preservation of the targeted components. The acceptance report separates the inlet result from the installed path result. No one treats agreement on a simple calibration mixture as a completed test of the whole process measurement.
Diagnose slow or unstable gas analyzer readings
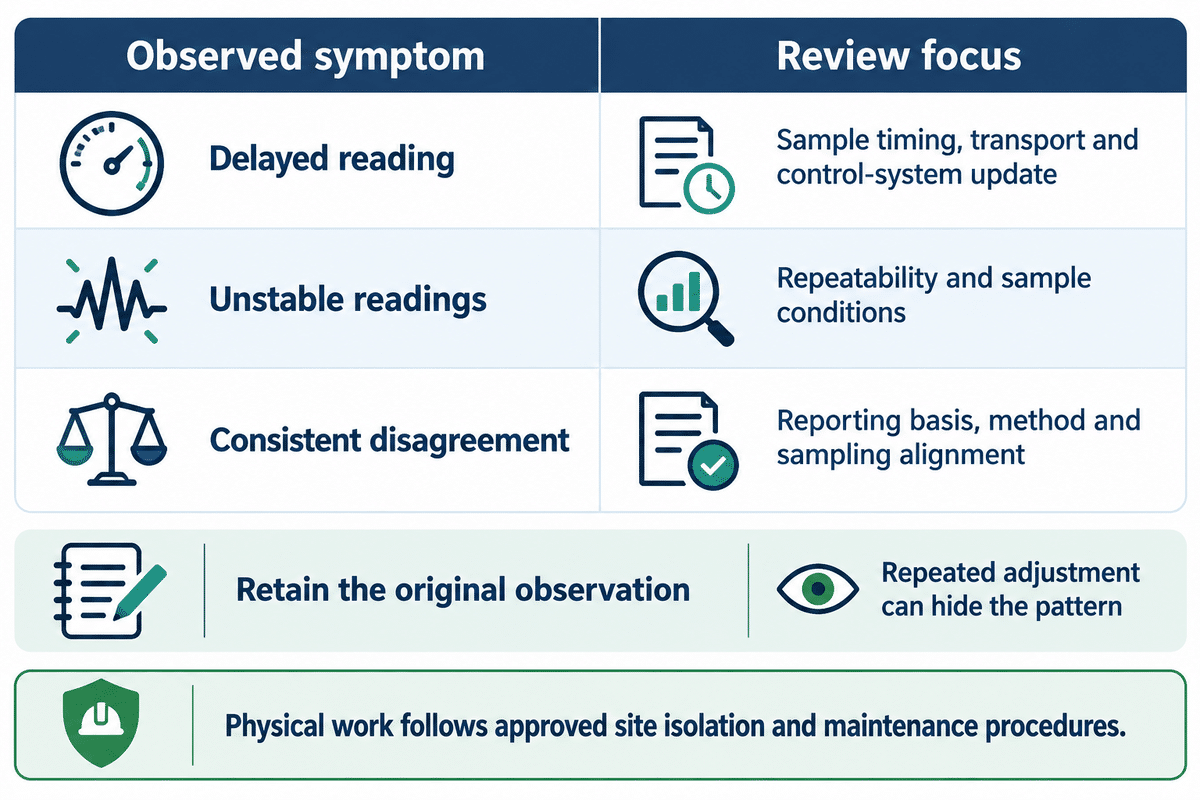
Always sort symptoms before making changes to calibration. If there’s poor response, check timing and sample movement. If there are unstable readings, check repeatability and conditions. If there’s a consistent disagreement, check the basis on which the sample is reported, and the method of sampling and analysis. The diagnostic report should retain the original observation, so that an adjustment doesn’t alter the pattern.
For a delayed reading, compare the sample timestamp, analysis cycle and control-system update. For a persistent offset, compare wet/dry basis, calibration convention and the components included in each result. For erratic readings, the review can examine pressure or temperature variation, stream switching and contamination within the approved maintenance procedure.
In a Control Global interview, consulting technologist Michael Chaney mentions reviewing process tap to control system interface before handing over an analyzer for control. That boundary prevents a communications or conditioning problem from being reduced to a detector adjustment.
Separate fault investigation from hazardous process intervention. The diagnostic sheet identifies the responsible specialist and what’s needed; site approved isolation and sampling and maintenance procedures govern the physical work.
Choose the supplier by its documented measurement scope
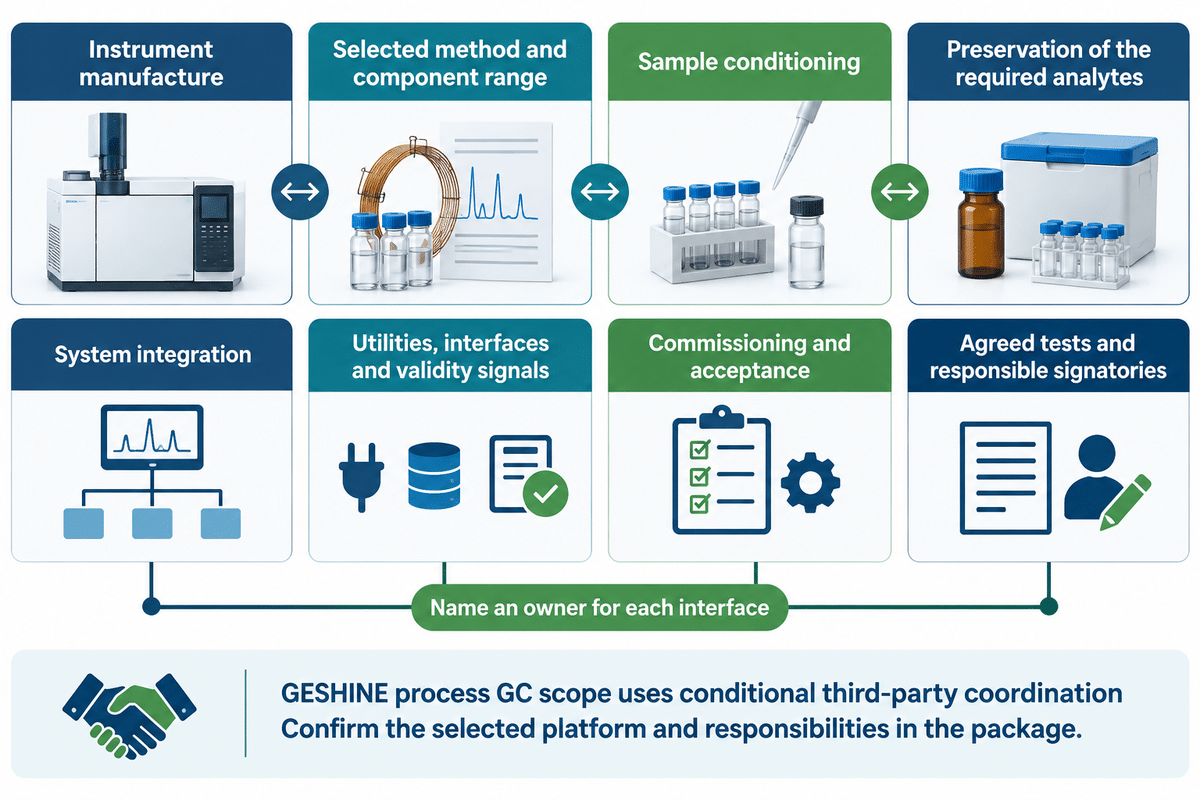
A supplier’s responsibilities must align with the client’s measurement duty and connect with other components of the system. Instrument manufacture, sample conditioning, integration and commissioning are separate scopes. The purchase needs a named owner for each interface, especially when a third-party analyzer forms part of the package.
Examples of current offerings include Agilent’s 990 Micro GC refinery configurations and Thermo Scientific’s TRACE 1610 refinery gas analyzer configurations. These are examples of published offerings, not interchangeable packages, or endorsements. Compare the channel and component list, and then ask the integrator to define sampling and site acceptance responsibility for that configuration.
GESHINE offers process gas analyzers for defined components and applications. For complete process GC, GESHINE’s GC integration scope employs conditional third-party coordination rather than GESHINE manufactured chromatographs. The selected platform, sampling responsibility and commissioning work belong in the agreed package.
IEC 62381:2024 provides a useful automation-system framework for owner, buyer and vendor agreement on acceptance activities. The 2024 edition adds optional factory integration testing. Project-specific testing scope is more valuable than attaching all possible tests to every instrument order.
Prepare a refinery gas analyzer quotation
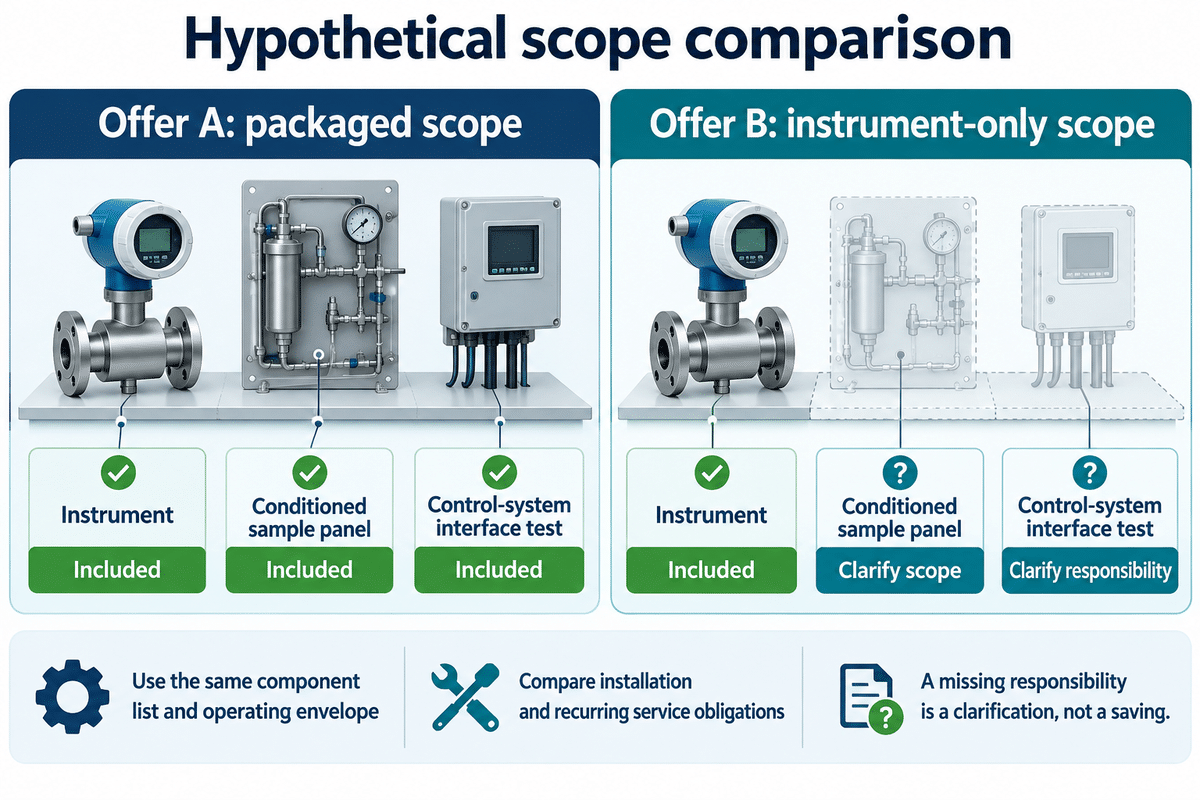
Construct one measurement scope and give the same measurement scope to all bidders. The measurement scope includes the process stream, required outputs, operating envelope, sample handling, utilities, interfaces, and acceptance responsibilities. Compare the complete installed scope and recurring obligations prior to comparing the instrument price in isolation. A missing responsibility is a quotation clarification, not a saving.
The ISA automation knowledge framework places equipment data sheets, environmental conditions, performance, communication and testing within system design and procurement. These fields help the technical and commercial teams align when reviewing quotations.
Create a comparison worksheet with a row for each of the following and columns for bidder, included, customer supplied, excluded, responsible party and acceptance evidence. For example, mark a sample panel as included only when the offer identifies its design envelope and delivery responsibility; record the site test separately.
Quotation handoff checklist
- Identify the stream and the decision supported by each measurement.
- List components, groups, ranges and units, including sulfur scope and wet/dry basis.
- Provide normal, startup and upset envelopes relevant to the instrument design.
- Assign probe, transport, conditioning and sample-return responsibilities.
- Specify utilities, carrier or calibration gases, data interfaces and validity flags.
- Agree the acceptance boundary, reference method, materials and responsible signatories.
- Confirm installation, training, consumables, spares and service scope in each offer.
Example: (hypothetical) Two bids are made for the same composition measurement. One bid includes a conditioned sample panel as well as a control system interface test, while the other bid just includes the instrument. Procurement splits both offers into the same line items. Operations identifies the maintenance work it can absorb, and finance assigns the omitted installation and recurring service costs to the comparison. While the instrument bid price may be lower, the complete cost may not be, and that decision rests on equivalent scope. The work scope also shows who needs to resolve a failed site acceptance test.
For a defined project, provide a component list and operating envelope to discuss the measurement scope. Also indicate whether the requirement is composition, a dedicated process quantity, emissions measurement or ambient protection.
Refinery gas analysis FAQs
Why is refinery gas analysis required?
It provides the composition or component measurements needed for a defined process, quality, emission or safety decision.
The scope can be narrow: a dedicated oxygen or hydrogen measurement may answer a control question without complete speciation. Fuel characterization, catalyst protection and applicable flare monitoring can require different analytical information. Start with the operating decision and its required quantity, then select the method and sample system. A broad instrument label isn’t a measurement specification.
Is refinery gas the same as natural gas?
No. Refinery streams arise from different processing duties, while natural gas describes a different fuel source and supply context.
Their component lists can overlap, but one composition assumption shouldn’t be transferred between them. A refinery fuel blend can change with the contributing units and operating mode. Natural gas arriving through a pipeline also has its own specified quality. The analytical scope follows the measured stream, including hydrogen, inert gases, sulfur species and grouped hydrocarbons where relevant.
How often should a refinery gas analyzer be calibrated?
Use the interval required by the applicable method, instrument and site monitoring plan; there is no single interval for every refinery measurement.
For example, 40 CFR 63.671(e)(4) specifies daily calibration and quarterly audits for its applicable flare gas chromatographs. That schedule must not be transferred to unrelated process duties. Validation records, drift and maintenance also inform the plan. Separate a check of performance from an adjustment, and retain the results that justify any change.
How many ppm is 1% gas?
One percent equals 10,000 parts per million on the same fraction basis.
Thus 1 vol.% is 10,000 ppmv. Keep the constituent and wet/dry basis unchanged. This arithmetic doesn’t convert %LEL to ppmC.
Can one calibration mixture cover every refinery gas stream?
No. A calibration mixture must suit the measured components, ranges and analytical method.
A mixture for one fuel stream can omit a component needed in another. Reactive constituents also require suitable stability and handling arrangements. The certificate, balance gas and intended concentration range belong with the method definition. A cylinder containing the correct names isn’t enough when the validation range or matrix is wrong.
For applicable flare monitoring, section 63.671 provides defined compound-specific and surrogate mixture routes with associated conditions. These are method-specific provisions, not a universal percentage rule for how closely every calibration blend must resemble a process sample. The calibration plan should connect each mixture to its intended channel, range and validation task.
References & Sources
- ASTM D7833-20: hydrocarbon and nonhydrocarbon gas analysis
- ASTM D5504-20: sulfur compound analysis
- ASTM D3764-23: process analyzer performance validation
- 40 CFR 63.670: applicable flare requirements
- 40 CFR 63.671: flare monitoring systems
- OSHA Technical Manual: direct-reading instruments
- Ian Verhappen: Basics of Analyzer Sample Systems
- Control Global: Gas Chromatographs Rule
- IEC 62381:2024: automation acceptance testing
- ISA CAP Body of Knowledge